Figure 10.7 shows the number of animal species in different classes that are on the IUCN Red List of Threatened Species for different years.
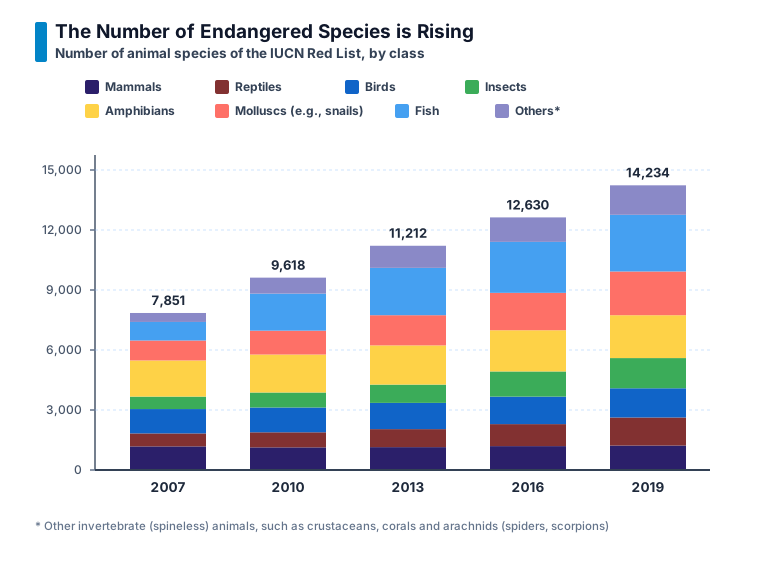
Figure 10.7: Endangered animal species on the IUCN Red List from 2007 to 2019
- (i)What does the number 14,234 on top of the column for 2019 represent?
- (ii)Approximately how many reptile species were in the list in 2016?
- (iii)Which classes of species have seen a relatively small increase in count between 2007 and 2019?
In a stacked column chart, the total height of a column represents the sum of all its segments.
Therefore, 14,234 represents the total number of animal species across all the classes shown on the IUCN Red List in 2019.
14,234 animal species
Reptiles form the second segment from the bottom of the 2016 column. The number of reptile species is estimated by reading the height of this segment using the vertical scale.
From the chart, there were approximately 1,100 reptile species in 2016.
Approximately 1,100 reptile species
By comparing the thickness of each coloured segment in the 2007 and 2019 columns, mammals, reptiles and birds appear to have experienced relatively small increases compared with several other classes.