Naman Academy For Class 9
Chapter 10: How Quantities Combine: Understanding DataAll 1 Questions on This Page

Class 9 Maths Chapter 10 Exercise Set 10.5 Solutions

Step-by-step solutions for Class 9 Mathematics Ganita Manjari Part 1I Chapter 10 Exercise Set 10.5 (Question 1). Covers interpreting and constructing 100% stacked bar charts of daily activity distributions across different occupations.

💡 Quick navigation: Tap any question number in the bar below to jump straight to that question and its step-by-step solution.← Chapter Overview
Jump:

Key Concepts for Exercise Set 10.5

Jump to Question 1
1

100% Stacked Bar Charts (Relative Distributions)

In a 100% stacked bar chart, the total length of each bar is normalized to 100%, representing a complete whole (such as 24 hours of a day). Each segment indicates the percentage share of an individual component, enabling proportional comparisons across categories regardless of varying base totals.

Percentage of time = (Hours spent on activity / Total hours) × 100%

The smart watch data of 5 people was tracked from Monday to Friday. The recorded data tells us how many hours each person spent lying down, sitting, and standing or moving around, etc., as shown in the following table.

Table 10.3: Average number of hours spent per day (Monday–Friday) lying down, sitting, and standing or moving around, etc., of 5 people
Person Lying down Sitting Standing or Moving around etc.
Pavani (Patient) 20 3 1
Raghu (Nurse) 7 4 13
Zakir (Teacher) 8 6 10
Sahana (Student)
Julie (________) 8 10 6
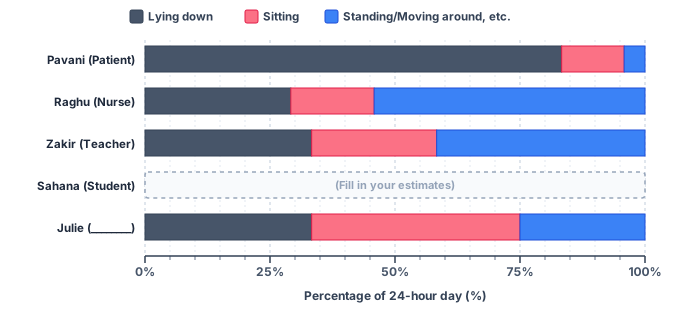
100% stacked bar chart showing average daily hours in different body states
  • (i)How much time does Sahana spend per day in each of these body-states? Make a reasonable guess and fill her row in the table.
  • (ii)Guess what activity or work Julie could be engaged in based on the data. Find out what your classmates' guesses are.
  • (iii)Complete the chart below based on the tabular data.
Solution
(i) How much time does Sahana spend per day in each of these body-states? Make a reasonable guess and fill her row in the table.

A day has 24 hours. One reasonable estimate for Sahana is:

Lying down + Sitting + Standing/moving = 24

Taking lying down = 8 hours and sitting = 9 hours,

Standing/moving = 24 − (8 + 9) = 7 hours

Hence, Sahana's row can be filled as follows:
PersonLying downSittingStanding or moving around
------:---:---:
Sahana (Student)8 hours9 hours7 hours

Other reasonable estimates are also possible, provided the total is 24 hours.


(ii) Guess what activity or work Julie could be engaged in based on the data. Find out what your classmates' guesses are.

Julie spends 8 hours lying down, 10 hours sitting, and 6 hours standing or moving around.

Since Julie spends a large part of the day sitting, she could be an office worker whose job involves sitting for long periods.

Other guesses are possible because the table does not tell us Julie's actual occupation.


(iii) Complete the chart below based on the tabular data.

The given chart is a 100% stacked bar chart. Each person's total time of 24 hours is represented by 100%.

The percentage of time spent on an activity is calculated as:

Percentage of time = (Hours spent on the activity / 24) × 100

For Sahana:

Lying down:

824 × 100% = 33.33%

Sitting:

924 × 100% = 37.5%

Standing or moving around:

724 × 100% ≈ 29.17%

The cumulative boundaries for drawing Sahana's bar are:

•Lying down: 0% to 33.33%
•Sitting: 33.33% to 70.83%
•Standing or moving around: 70.83% to 100%

The three segments together represent 100% of Sahana's day.
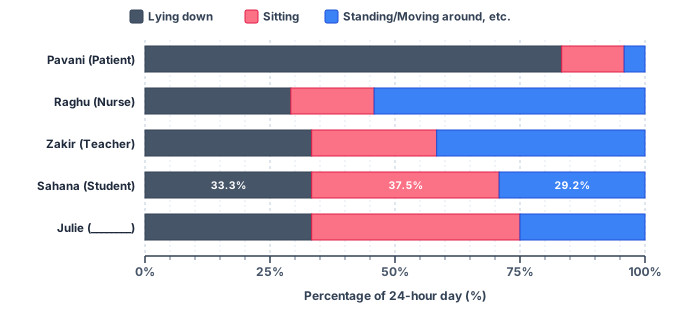
Completed 100% stacked bar chart showing Sahana's day
Answer:Sahana: Lying down = 8 h (33.33%), Sitting = 9 h (37.5%), Standing = 7 h (29.17%) | Julie: Office worker whose job involves sitting for long periods

Need to practice other sections in Chapter 10?

Return to Chapter 10 (How Quantities Combine: Understanding Data)→